


Share of Search (commonly SoS) is a dynamic metric which quantifies a brand’s digital presence with the vast expanse of online searches. It highlights a brand’s position relative to competitors, serving as a pivotal indicator of brand visibility, customer interest, and even a proxy for market share. In industry studies (such as those from Les Binet) and in Kantar’s validation studies for our clients, we have shown that SoS correlates with both salience and sales.
Share of Search may seem deceptively simple to measure, but requires careful navigation to extract meaningful insights effectively.
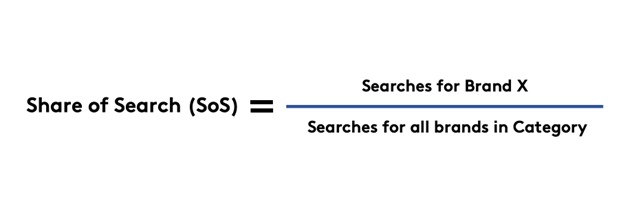
So how do we calculate this powerful metric?
We calculate it by comparing the volume of searches for one brand against the total search volume encompassing all brands within a specific category. Simple in formula, yet intricate in precision, nailing the Share of Search (SoS) metric proves a thrilling challenge.
Why is it challenging to calculate?
While calculating Share of Search might seem straightforward, achieving accurate results requires a thorough consideration of multiple factors. To illustrate this point, we'll explore two methods for calculating SoS within a selection of auto brands.
Let's begin by examining a straightforward and widely used method for calculating Share of Search, which we can refer to as our naive model. We focused on six major automobile brands and computed their Share of Search using Google Trends index data. A major limitation of this approach is that Google Trends only allows for the analysis of five search terms, or brand topics, at a time. To include more, you'll need to swap out brands, which can lead to potential inaccuracies if not handled carefully. The Share of Search for our five brands, over the last four years, is shown on the chart below:
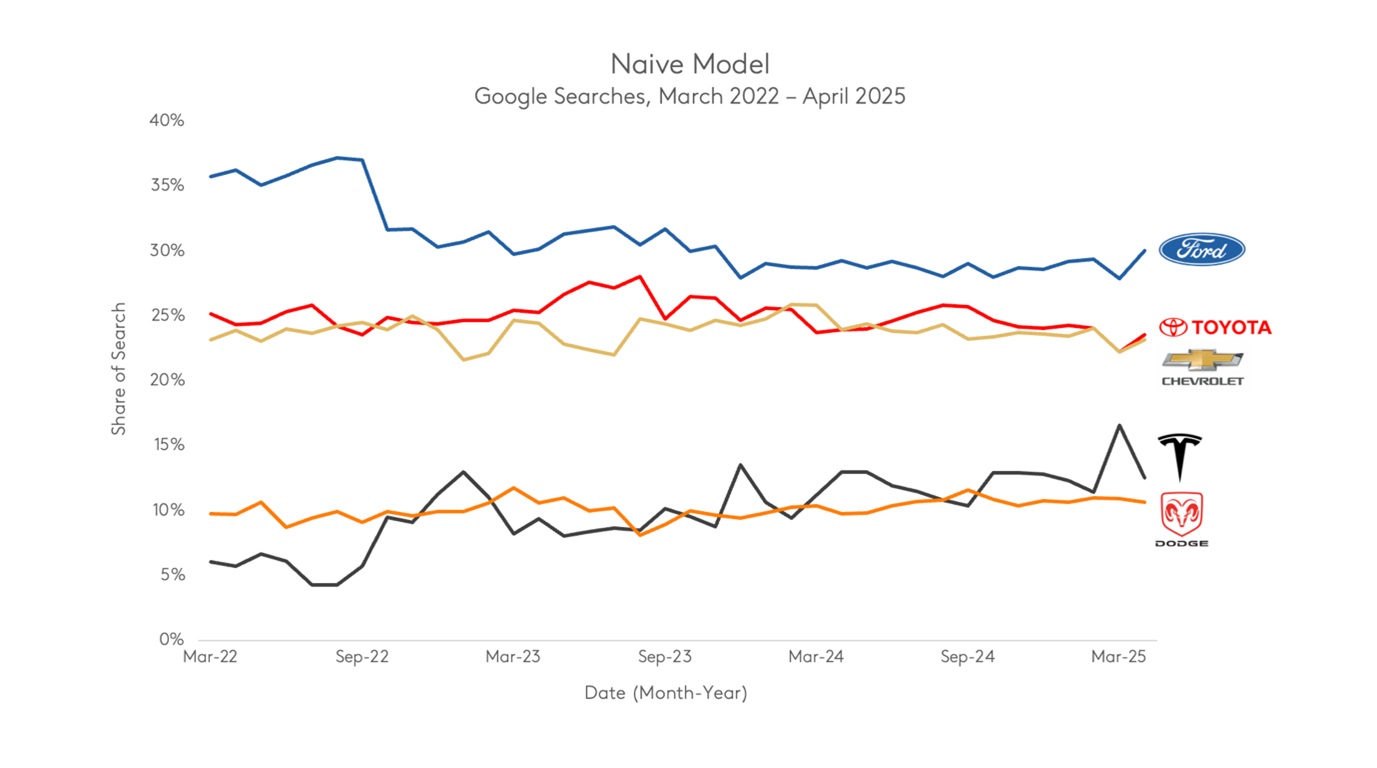
Ford is leading the chart, with Toyota and Chevrolet not far behind. Meanwhile, Dodge is competing with the innovative yet polarizing Tesla. Despite its strong lead, Ford’s share of search is slowly declining as smaller competitors chip away at consumer interest—especially Tesla, which has managed to pull ahead of Dodge and continues to grow its share. Now, if you're a die-hard Cybertruck fan, you might not bat an eye. But there are some important factors messing with the accuracy of this naive model. To compare, let’s look at a more holistic model, generated using Kantar’s tools and expertise.
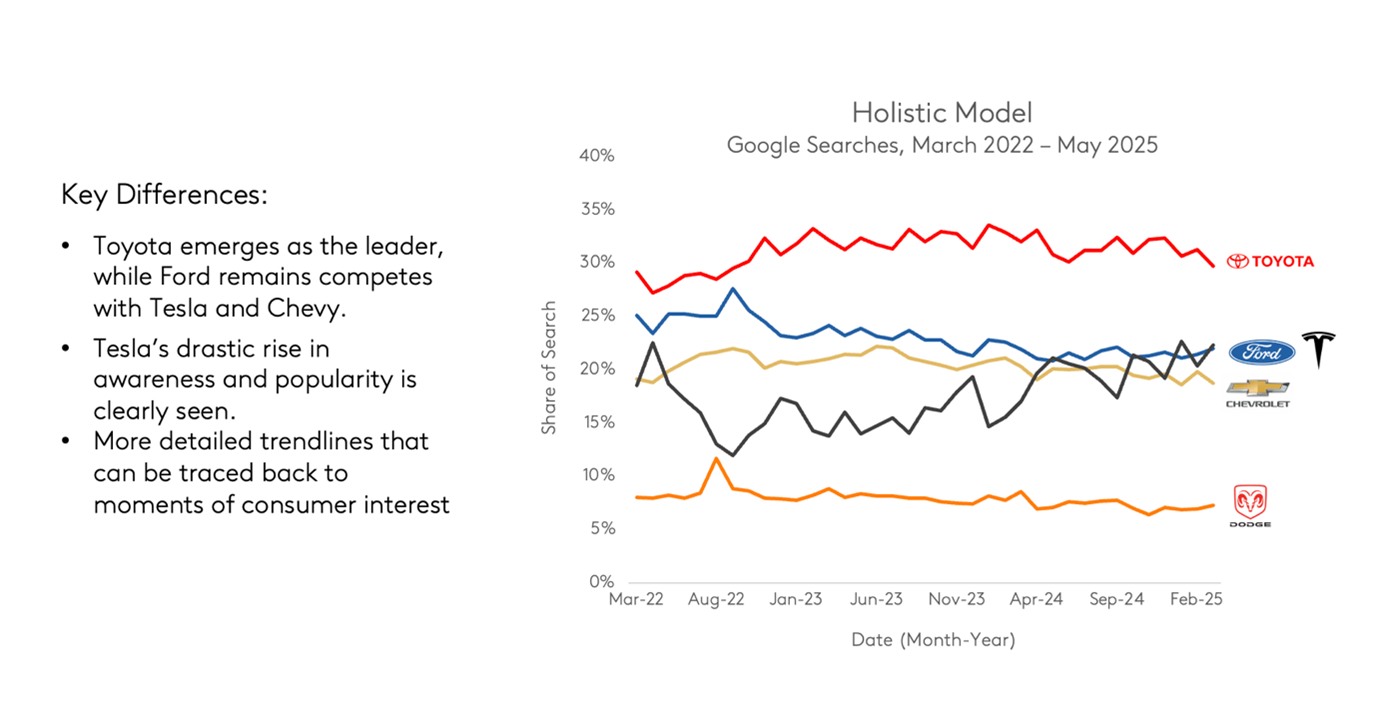
You’ll notice there’s a significant difference between these two charts. This is because our holistic model is taking into account the complexities of the data, and this metric. As we build out our model, here are some of the extra steps we take to recognize these complexities, and improve accuracy:
-
Uncover the Full Spectrum of Search Keywords
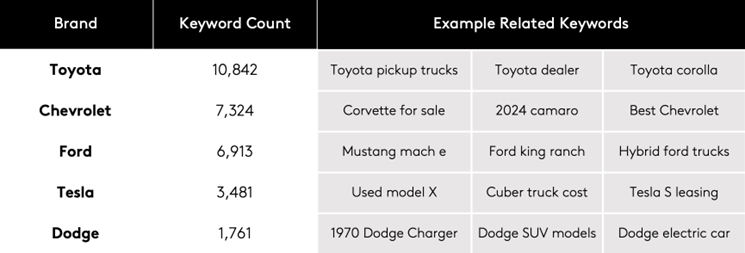
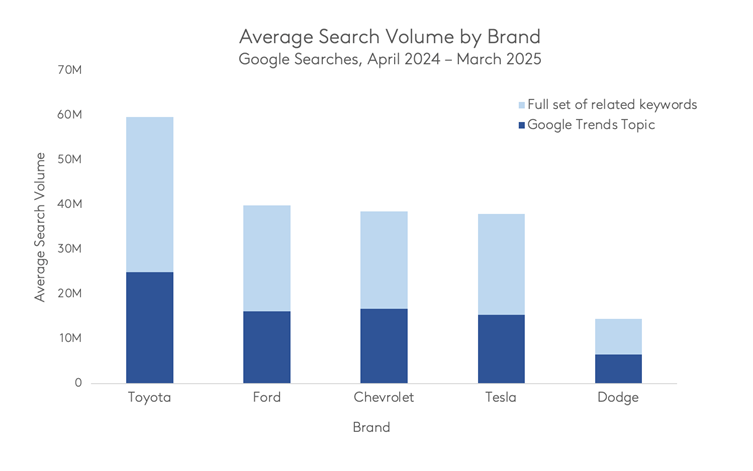
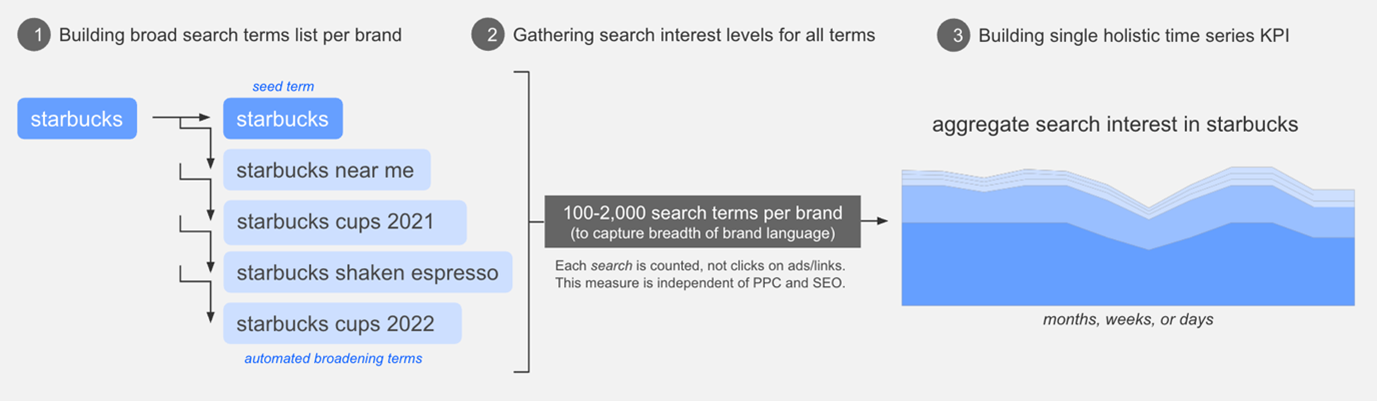
The initial step in constructing Share of Search involves making a strategic choice regarding the terms to monitor. In our basic example, we opted to use the Google Trends pre-built “Car Make” category for each of our brands, which serves as a reliable foundational measure for gauging size and popularity. It’s true that a chunk of consumers searching for Chevrolet simply type ‘Chevrolet’ into their search bar. However, it's also true that consumers are using hundreds of other keywords and terms to search for the same brand. These encompass car models, location information, features, and beyond. While Google Trends may capture the topline view, it's important to include all these terms to accurately capture overall brand interest. Using Kantar Dx’s search tools and Google Trends, we expanded on our five brands and collected 30k related keywords. On average across brands, these additional keywords represent a 36% increase in search interest that was previously unaccounted for, based on volume.
Expanding from a few key terms to hundreds not only makes our model more accurate but also tells us what people are searching for within each brand. Using this granular detail, we can uncover the reasons behind shifts in consumer interest towards different brands.
-
Correct for ambiguous search behavior
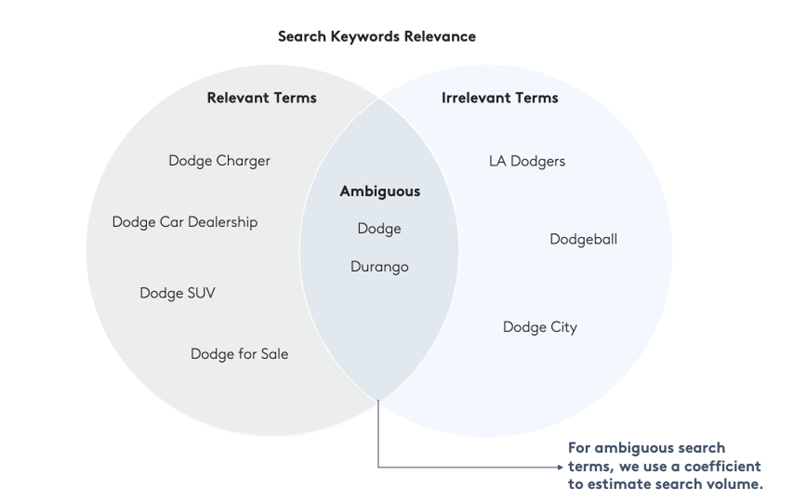
Sometimes, the brands we're looking into have names that are also everyday words. Take Dodge as an example. If we were to just gather the total volume for ‘dodge’ it would also include people intending to search for the verb "dodge," unrelated sports or games, like “dodgeball” or the Los Angeles Dodgers. To avoid this, we have to add qualifiers like “car” to make sure we are capturing only relevant results. But this means we're missing out on people who are simply searching for 'dodge' to find the auto brand. To fix this, we can remove the irrelevant keywords, use more specific terms to increase relevance, and adjust how we count the overall search numbers for any ambiguous terms.
-
Seamlessly incorporate in new products
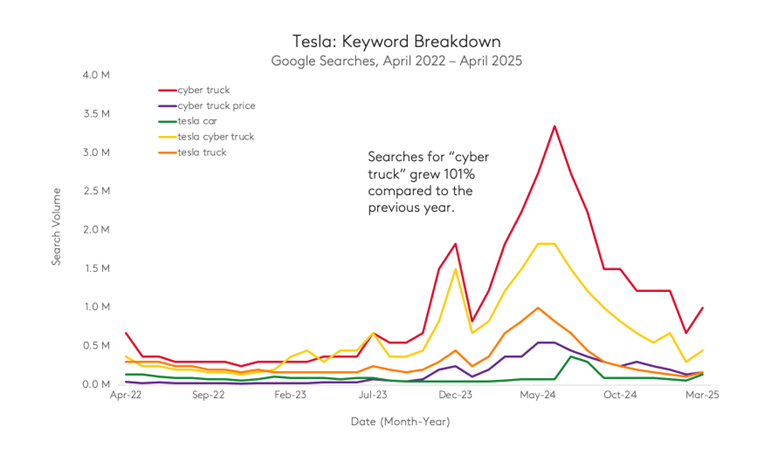
To ensure our model remains accurate, we need to continually update the underlying keyword list as brands undergo changes and developments. The introduction of new products, campaigns, or promotional strategies released by brands can substantially alter their position in search order. Kantar’s tools naturally catch these new initiatives and integrate them into an updated Share of Search measurement. In our example, we see a bump in Tesla’s Share of Search once in December 2023 and again in June 2024. Digging into the keyword data, we find that Tesla launched the Cybertruck in late 2023, but the real peak in conversation happened around June 2024, as recalls drew more attention to the product. Searches took some time to dip back down after this, indicating that the Cybertruck has kept consumer interest.
-
Capture interest in iconic products
Sometimes, a brand offers products that are exclusively associated with them. Consumers may not search for them in conjunction with the brand’s name. In our category, a few automobile brands have products that are exclusive to them. For instance, Toyota’s trademarked RAV4. People searching for this product might simply search for “RAV4” and may not even realize that this model is associated with Toyota. Even though the brand name isn't included, the interest in these products still reflects overall interest in the brand, so it’s crucial that we capture and include these searches.
A Comprehensive Model
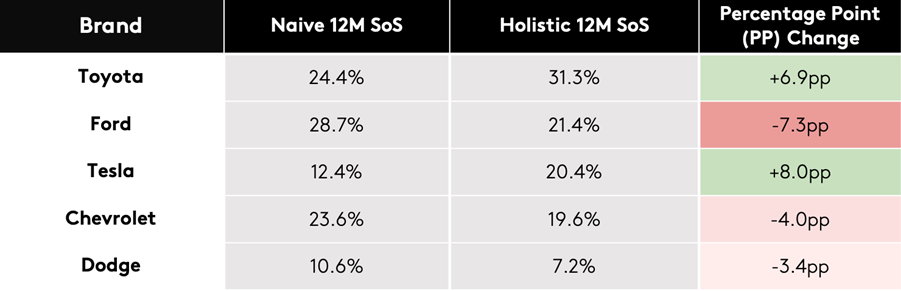
Taking into account these variables, we've refined our model to achieve greater accuracy. This improved version encompasses a diverse range of keywords, accommodates common brand names, remains current with new offerings and initiatives, and balances the awareness of products versus the overall brand. Let’s recap the result of these changes:
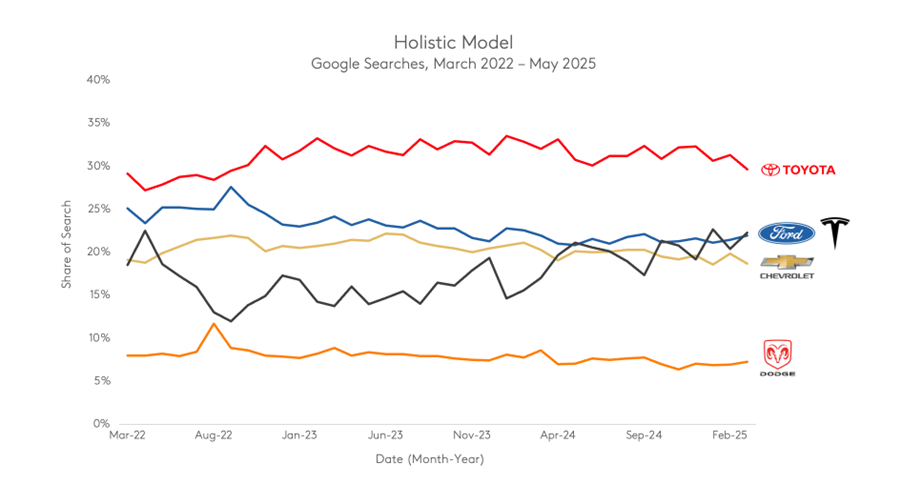
Firstly, we see a detail in the trendlines for the five brands where each peak and valley can be traced back to the 30k keywords that we included. Toyota leads the pack, bolstered by the iconic RAV4, while Ford drops down to compete with Chevrolet. In our basic model, Dodge appears as a stronger competitor, likely due to some irrelevant search interest that bumped up its overall share. Tesla’s growth is much more pronounced, driven by its controversial yet exciting new product launches that sparked increased attention and conversation.
Conclusion
Share of Search is a double-edged sword: it appears straightforward and easy to calculate, yet holds hidden complexities in extracting optimal insights. But with the right consideration and care, it’s a powerful tool that can give us intricate insights on brand visibility and share of growth.
To properly analyze SoS for clients, Kantar has an AI-driven analytics engine that expertly navigates the intricacies of this metric. BrandDigital, a Kantar Analytics product, includes detailed and comprehensive Share of Search tracking. Our team of Analytics experts are equipped to guide you through an exploration of Share of Search data over time, ensuring a comprehensive understanding of both the metric and the unique complexities of your specific category.
To fully leverage Share of Search and boost your brand’s effectiveness, integrating it with Kantar’s Blueprint for Brand Growth can be transformative. By using SoS to optimize your brand’s predisposition, you can effectively increase salience and drive stronger growth outcomes.
Learn how aligning SoS with Blueprint’s framework can maximize your brand’s impact here.